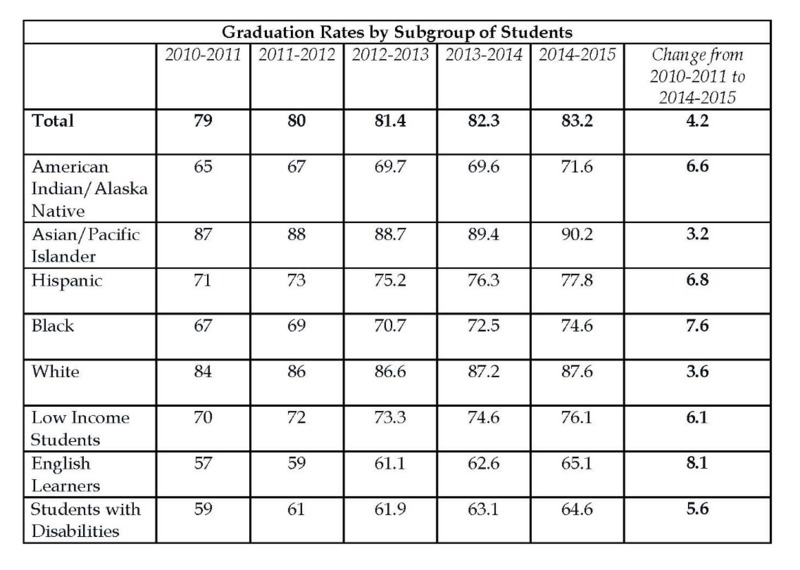
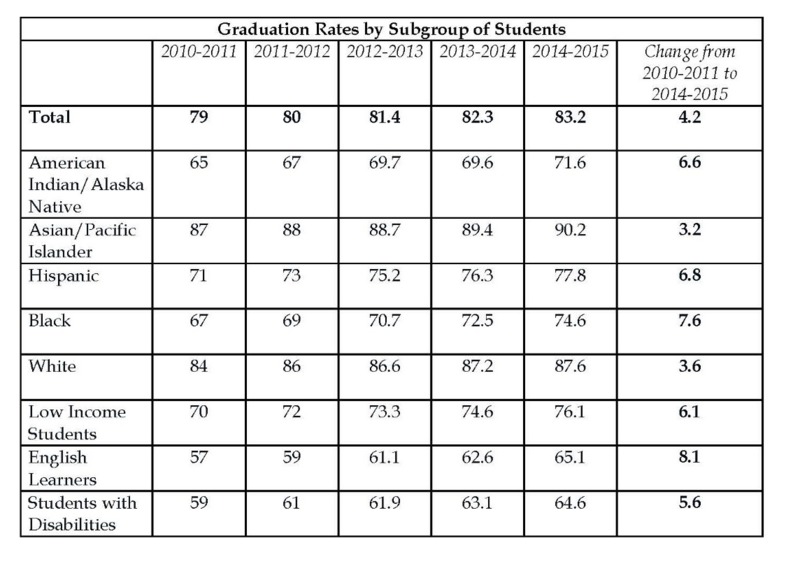
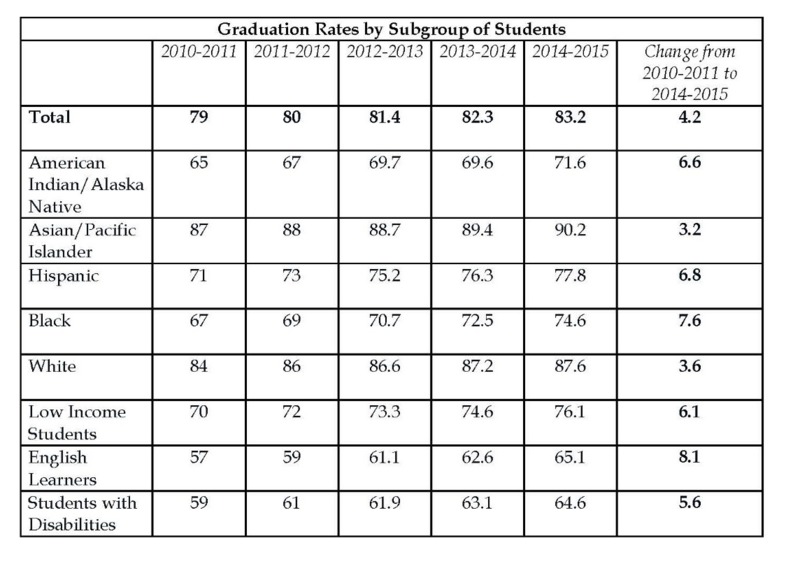
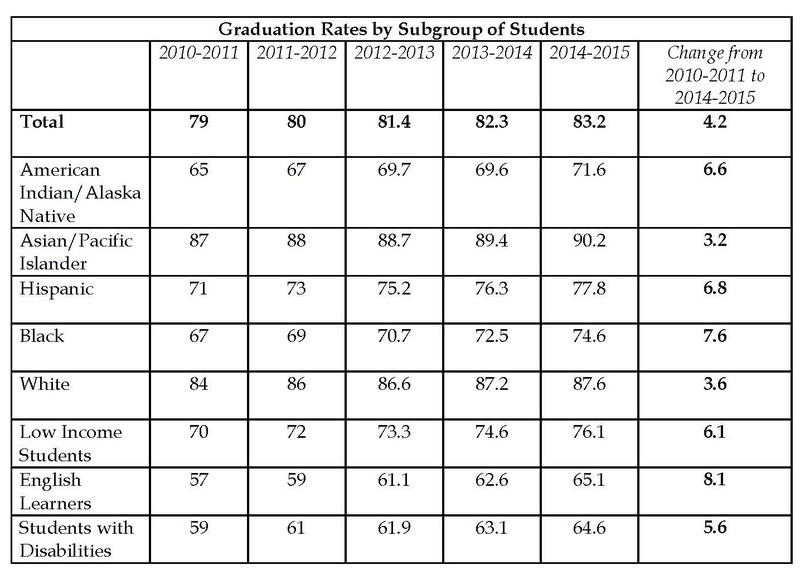
High School Graduation Rates by Subgroup of Students between the years 2010-2015
Dublin Core
Title
High School Graduation Rates by Subgroup of Students between the years 2010-2015
Description
The information in the graph comes from the year-by-year data from the National Center for Education Statistics. This data is looking at the United States as a whole. Not every state has a positive increase over the years but the nation as a whole does.
Creator
National Center for Education Statistics
Coverage
Anyone who identifies as American Indian/Alaska Native on a government census.
Publisher
The White House Office of the Press Secretary
Identifier
https://obamawhitehouse.archives.gov/the-press-office/2016/10/17/fact-sheet-president-obama-announces-high-school-graduation-rate-has
Citation
National Center for Education Statistics, “High School Graduation Rates by Subgroup of Students between the years 2010-2015,” ANTH 212: Peoples of Native North America FA18, accessed September 21, 2024, https://ctsdh.org/anth212/items/show/25.


